

Your Command Center
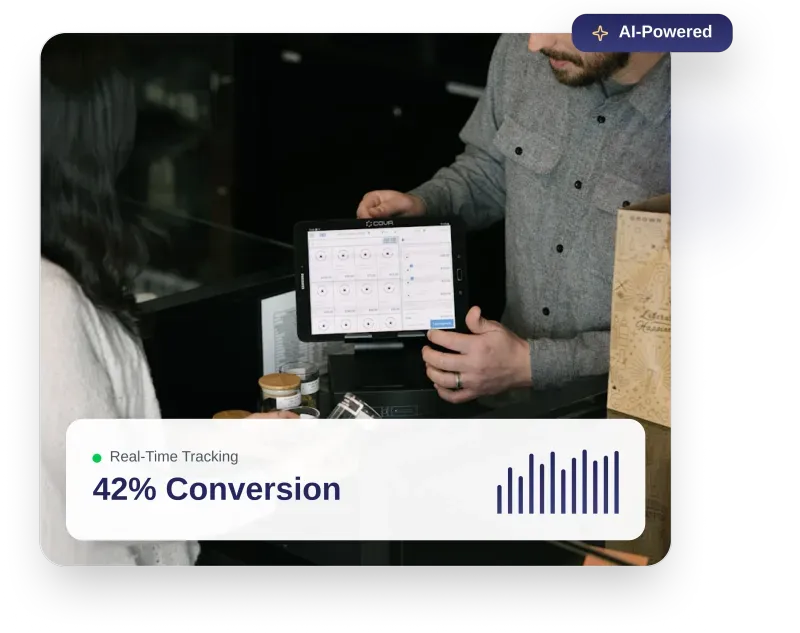
Real-Time Analytics Dashboard
Monitor every sample, track every conversion, optimize every campaign—all from AIM’s intuitive dashboard.
+12.5%
45,231
Opt-ins
+8.3%
38,947
Validated
+9.1%
37,152
Delivered
+5.2%
68.4%
Feedback %
-2.1%
42.7%
Redemption %
+15.8%
15,867
Purchasers
+3.4%
42.7%
Trial→Purchase %
+18.2%
₹1.2Cr
Revenue
Conversion Funnel
Opt-ins
45,231
↓ -14% drop-off
Validated
38,947
↓ -4% drop-off
Delivered
37,152
↓ -14% drop-off
Redeemed
19,311
↓ -8% drop-off
Purchased
15,867
Touchpoint Performance
Channel
Requests
Validated
Conv %
CPP ₹
Retail Stores
12,450
10,830
45.2%
₹89
Instagram Influencers
8,920
7,456
52.8%
₹142
Corporate Cafeterias
6,780
5,890
38.9%
₹67
Facebook Ads
5,340
4,123
35.2%
₹156
Website Pop-up
4,890
4,201
41.7%
₹34
RWA Screens
3,670
3,156
44.3%
₹78
Gym Counters
2,181
1,867
48.1%
₹92
Top Cities
Mumbai
12,450
45.2%
Delhi
9,870
42.8%
Bangalore
8,920
48.3%
Pune
5,340
41.7%
Hyderabad
4,890
39.2%
6-Month Trend
May
Jun
Jul
Aug
Sep
Oct
Opt-ins
Purchases


